Physical Address
304 North Cardinal St.
Dorchester Center, MA 02124
Physical Address
304 North Cardinal St.
Dorchester Center, MA 02124

Since the CME announcement of the error, gold has closed around 4.215 on Friday.
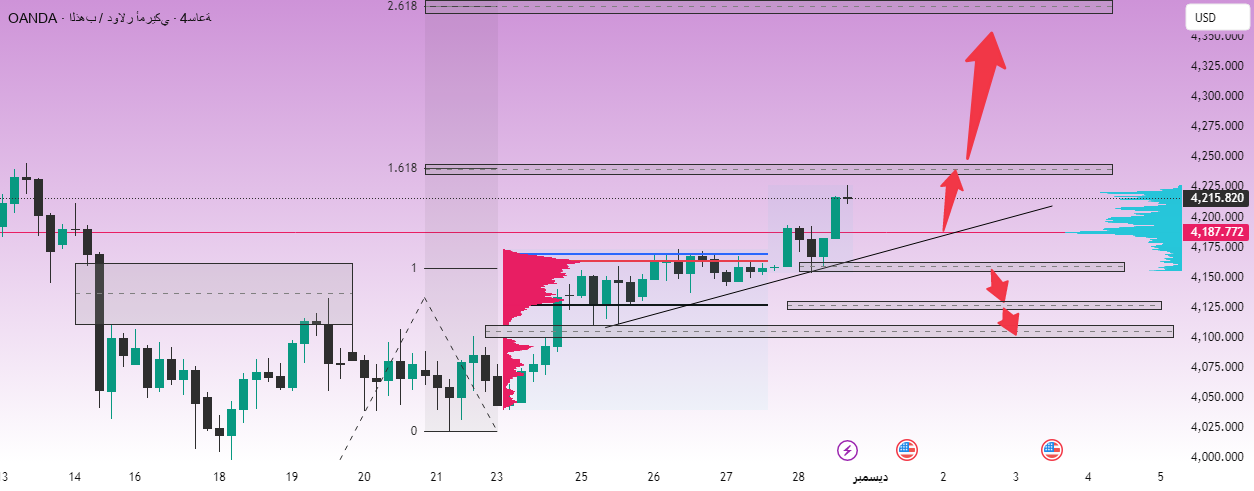
On the H4 framework, a clear and relatively stable bullish structure is forming as the price has just exited the multi-day accumulation zone and entered Fibonacci extension levels. In the current context, I would still prefer to buy on a pullback to POC in the medium term rather than chasing new highs.
🎯 Master Trading Plan – Buy DIP based on Fibonacci and POC
Buying entry point: around 4.187
Stop loss: 4.175
Reference target price: 4.225 – 4.240 – 4.290 – 4.300
The above target is set based on the H4 Fibonacci extension line, the area around 1.618 – 2.618 is the level where the market will experience strong profit-taking.
I accept risk in the 1-2% range of my account for each position, preferring to be long on the market rather than trying to catch the tops and bottoms of individual waves.
critical level:
4.160 is currently a strong support and “lifeline” for the H4 upward trend.
If the price breaks down and closes the H4 candle below 4.160, the current bullish structure is considered broken and I will stop the buy scenario and rebuild the plan, I may look into a deep correction sell scenario in my next article.
1. Basic background
Gold’s strong recovery has temporarily slowed down after a failed attempt to break above the 4,160 area.
However, the recent rally has come against the backdrop of a weaker U.S. dollar, even as U.S. bond yields attempt a full recovery.
Looking at the wider time frame, gold prices are heading for a fourth consecutive month of gains, after October’s gains focused the market on the 4,400 area.
Ongoing geopolitical concerns and expectations of further interest rate cuts from the Federal Reserve provide buyers with ample reasons to maintain medium-term positions regardless of short-term volatility.
Overall, fundamentals remain supportive to the upside unless there are significant changes in interest rate expectations or systemic risks.
2. H4 Technical Analysis – Fibonacci Insights
The previous accumulation zone around 4.160-4.185 was broken by a series of consecutive bullish candles, confirming a higher highs-higher lows structure for the fourth quarter.
POC volume moved into the area around 4,187, indicating that this area was heavily traded ahead of the breakout – a good time to wait for price to retest before buying again.
The Fibonacci extension levels of the recent bullish wave indicate that important resistance levels above are located at:
1.618: 4.24x area – first target for profit taking, prone to volatility.
2.618: 4.35x–4.36x area – Expansion levels for a very strong trend continuation scenario.
With this structure, I view any pullback around 4,187 as an opportunity to add to a medium-term buy position while holding 4,160, rather than a reversal signal.
3. Market psychology and business planning
After a strong rally, the market is in FOMO mode, chasing prices to higher territory. This is usually the stage where sudden adjustments appear to “soften” later positions.
I don’t participate in this stalking game. Instead, I waited for the price to move back to the POC 4.187 area (where significant volume had previously accumulated) to trade with a better R:R and tighter stops.
If the buyers are really strong, they will protect the 4.160-4.187 area; if not, it will be safer to remain vigilant after the structure is breached rather than trying to maintain visibility.
Plans for next week:
Prioritize buying near 4.187, stop loss 4.175, and target price based on the Fibonacci range 4.225–4.240–4.290–4.300.
If the price falls strongly below 4.160 and closes the H4 candle below, stop all buy scenarios and wait for a new structure to emerge before considering a sell scenario for correction.
Don’t buy and chase when prices are approaching Fibonacci extension highs unless there is a specific daily setup with a very clear stop loss.
If you find this outlook useful for your gold trading plans next week, please follow our TradingView account and leave a comment on the price areas you are waiting to enter. I always read comments to improve how I engage in upcoming analyses.


