Physical Address
304 North Cardinal St.
Dorchester Center, MA 02124
Physical Address
304 North Cardinal St.
Dorchester Center, MA 02124


1. Momentum
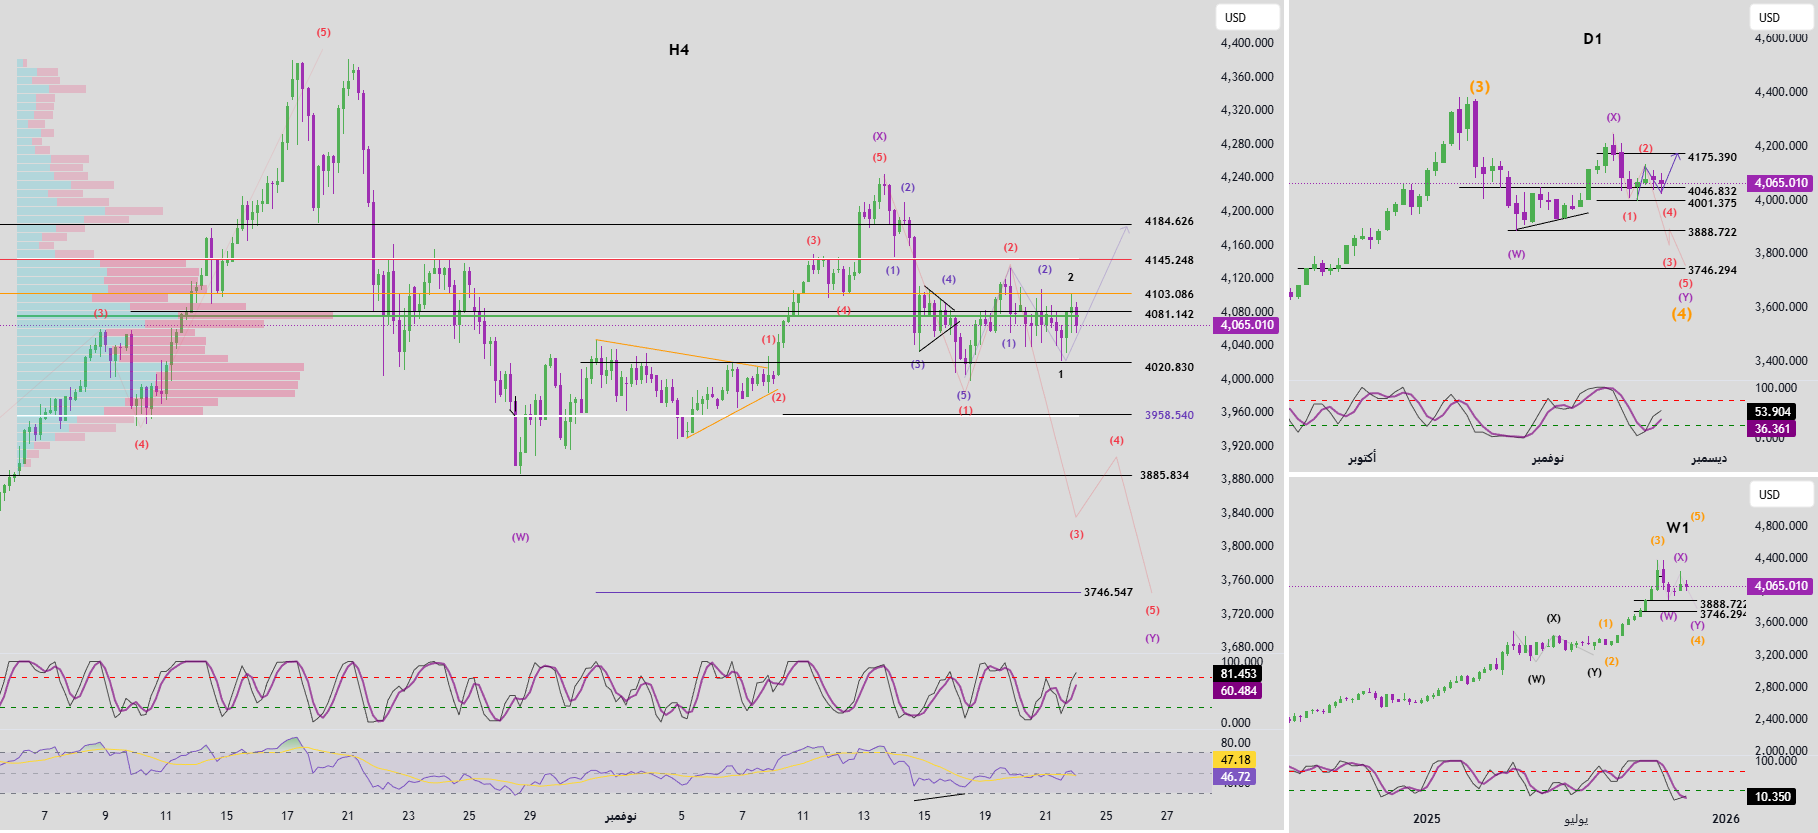
W1 – Weekly time frame
Weekly momentum shows early signs of a trend reversal. If next week’s candle closes with a confirmed green candle, the market could enter a 4-5 week uptrend, pushing weekly momentum into overbought territory.
D1 – Daily time frame
Momentum on the daily frame is still rising, indicating that the uptrend may continue for another 1-2 days before momentum enters the saturation zone.
H4 – 4 hour time frame
Momentum remains uptrend in the second half, which means further upside or sideways movement is likely on Monday.
________________________________________
2. Elliott wave structure
Weekly Structure (W1)
The last three weeks of candlesticks have been bullish, but don’t show significant strength:
• Two small candles
• A green candle with a long upper tail
This behavior indicates that the market may be in the final stages of Wave X (purple). Therefore, the main case remains for a continuation of the decline to complete the Y wave (purple) towards the lower target area.
After the Y wave is completed and the weekly momentum reversal begins, a new major uptrend may begin.
________________________________________
Daily structure (D1)
• Wave X (purple) may be complete.
• Price is now moving within the Y wave (purple).
Internal wave Y:
• Wave 1 (red) appears to be complete.
• Price is currently in wave 2 (red) or has started the first phase of wave 3 (red).
🔸 Key Confirmation Level:
If the price breaks above the 4001 level, it will confirm the entry into Wave 3 (red), which is usually a strong and sharp decline.
🔸 Alternatives:
As momentum on D1 remains bullish, Wave 2 may be forming into a WXY (Green Zigzag) correction pattern, meaning an additional bounce may precede a strong decline.
________________________________________
3. Wave structure on H4 frame
There are currently two scenarios compatible with the D1 structure:
• The market may have begun a third wave (red).
• Or the price is in the final stages of a wave 2 WXY correction (red).
The 4081 area currently serves as the balance area and is also the area with the highest transaction volume (green POC line).
• If the price remains below 4081 on Monday:
→ The probability of a wave 3 (red) scenario increases and the support levels 4020 and 3958 may be broken.
• If price remains above 4081:
→ The higher levels 4145 and 4184 become ideal targets for the end of the second wave (red).
________________________________________
4. Trading plan
📌 Restricted sales areas:
• 4145
•4184
📌Direct sales area:
• 4020 → Only valid if a strong H4 candle closes below 4020 and is subsequently retested.
A more detailed trading plan will be updated when new market data becomes available on Monday.