Physical Address
304 North Cardinal St.
Dorchester Center, MA 02124
Physical Address
304 North Cardinal St.
Dorchester Center, MA 02124

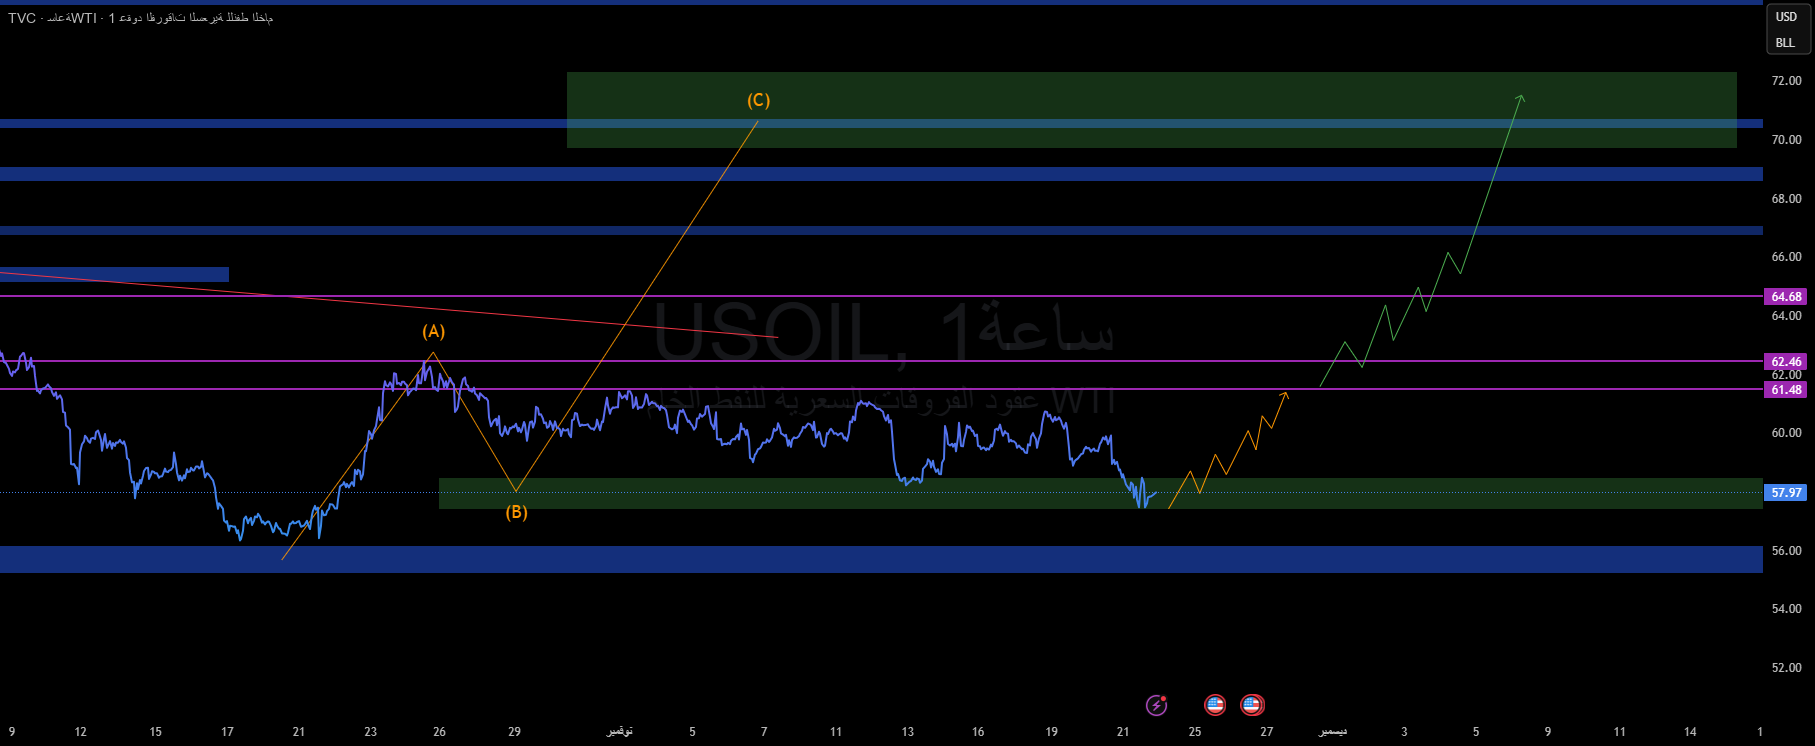
The oil moves in a clear waveform A → B → C:
Wave A ends at 64.60
Wave B falls sharply until the demand range is between:
57.20 – 56.60
Current price action shows strong liquidity absorption at the bottom with a clear rejection candle.
This pattern indicates the beginning of a broad upward wave C.
📌 (df-OIL-5521) Effective rebound area
Green area between:
57.20 – 56.60
This is the major reversal area.
Staying above this level means a bullish scenario is in place.
📌 (df-OIL-8840) Bullish Scenario (Baseline)
Once the price leaves the 58.20 zone, the bullish structure will begin to gradually move toward:
1️⃣ 61.48
2️⃣ 62.46
3️⃣ 64.68
4️⃣ 67.10 – 68.30
5️⃣ 70.50 – 72.10 (full wave C target)
The green path in the diagram accurately reflects this wave.
📌 (df-OIL-4410) Bearish scenario (less likely)
If 56.60 is broken and closed clearly:
Quick drop to: 55.10 – 54.20
A sharp rebound is expected thereafter due to huge demand.
But the probability is less than 20%.
📌 (df-OIL-1190) Suggestion
🔹 Incremental Acquisition (DCA):
57.20 – 56.60
🔹Stop Loss (SL):
Close below 56.40
🔹Target (TP):
61.48
62.46
64.68
67.10
70.50 – 72.10
🔹Additional entries:
When the strong candle breaks above 58.90.
📌 Conclusion – Control Academy 🔱
Oil is now emerging from a deliberate pressure wave and is preparing for a C-wave that will be ruthless to those who come after us. Entering without capital management is reckless…and the market does not reward recklessness. 🔱