Physical Address
304 North Cardinal St.
Dorchester Center, MA 02124
Physical Address
304 North Cardinal St.
Dorchester Center, MA 02124

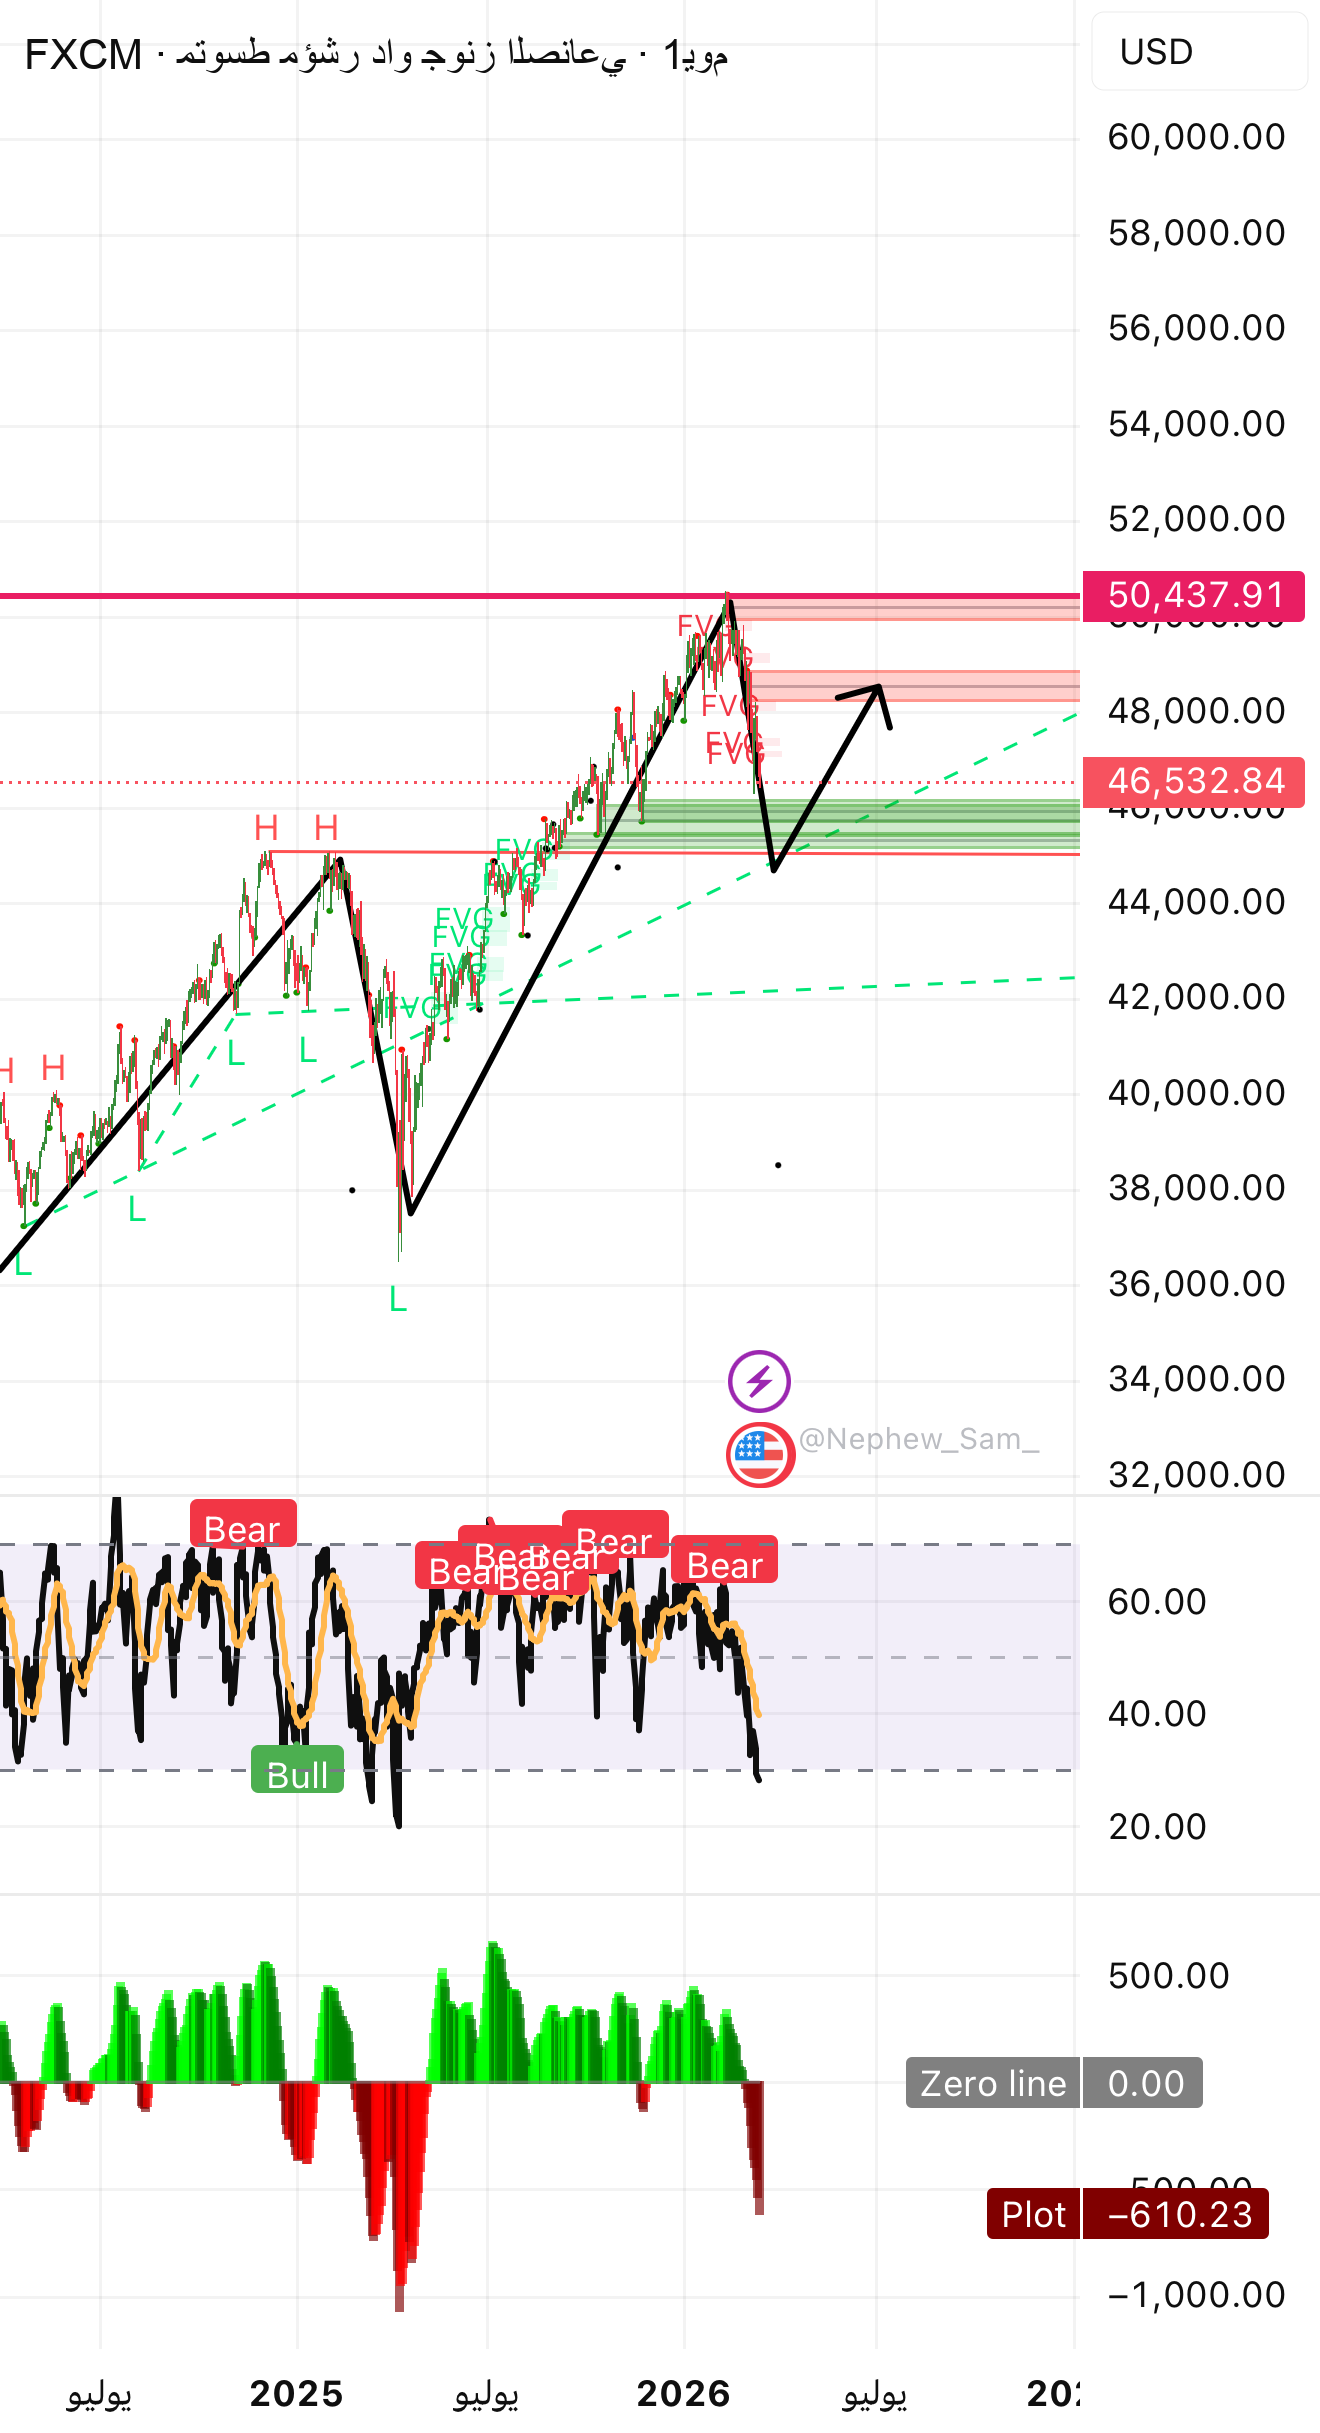

First – technical analysis
The overall trend remains bullish in the medium term as prices remain above the main uptrend.
But now it happens:
• Strong rebound from viewing area
• Beginning of short-term downward correction
The price failed to hold above the around 50,000 area and profit-taking started.
⸻
Second Wave Analysis (Elliott)
The movement looks like this:
1️⃣ Bullish impulse wave
2️⃣Correction
3️⃣Strong rising wave
4️⃣Lateral correction
5️⃣ The last wave of increase reached nearly 50k
Now it seems that the market has begun an ABC correction
expect:
A → landing
B → apostasy
C → final landing
Correction may end near 45,000-44,500 points
⸻
Third: Time Analysis
We are currently at the tail end of a long-term bull market cycle.
Most corrections continue:
5 to 10 trading sessions
Then a new upward wave begins.
⸻
Fourth – Numerical Analysis (Fibonacci)
Expected Bullish Correction:
38.2% → 46,000
50% → 45,200
61.8% → 44,300
Best potential bounce zone:
45,000 – 44,500
⸻
Fifth – Price Action
notes:
• Double peaks appear
• Strong rejection candle in 50k area
• Upward momentum broken
This suggests this is a temporary adjustment rather than a complete reversal.
⸻
Sixth: Supply and demand areas
Display area (sales)
50,000
49,500
48,800
These are strong sales areas.
⸻
Demand area (buy)
46,000
45,200
44,500
These are areas where buyers are likely to emerge.
⸻
Seventh: Support and Resistance Levels
resistor
48,800
49,500
50,400
support
46,000
45,000
44,200
⸻
Eighth: Fundamental Analysis
Factors currently affecting the Dow Jones Index:
1️⃣US interest rate cut expectations
2️⃣American corporate performance
3️⃣ CPI inflation data
4️⃣ Federal Policy
If inflation data is high → downward pressure
If it’s low → the stock makes a fresh move higher.
⸻
Expected scenario
Most likely scenario:
Correctiveness dropped to
46,000 → 45,200
Then try to crawl back
49,000 – 50,000
⸻


