Physical Address
304 North Cardinal St.
Dorchester Center, MA 02124
Physical Address
304 North Cardinal St.
Dorchester Center, MA 02124

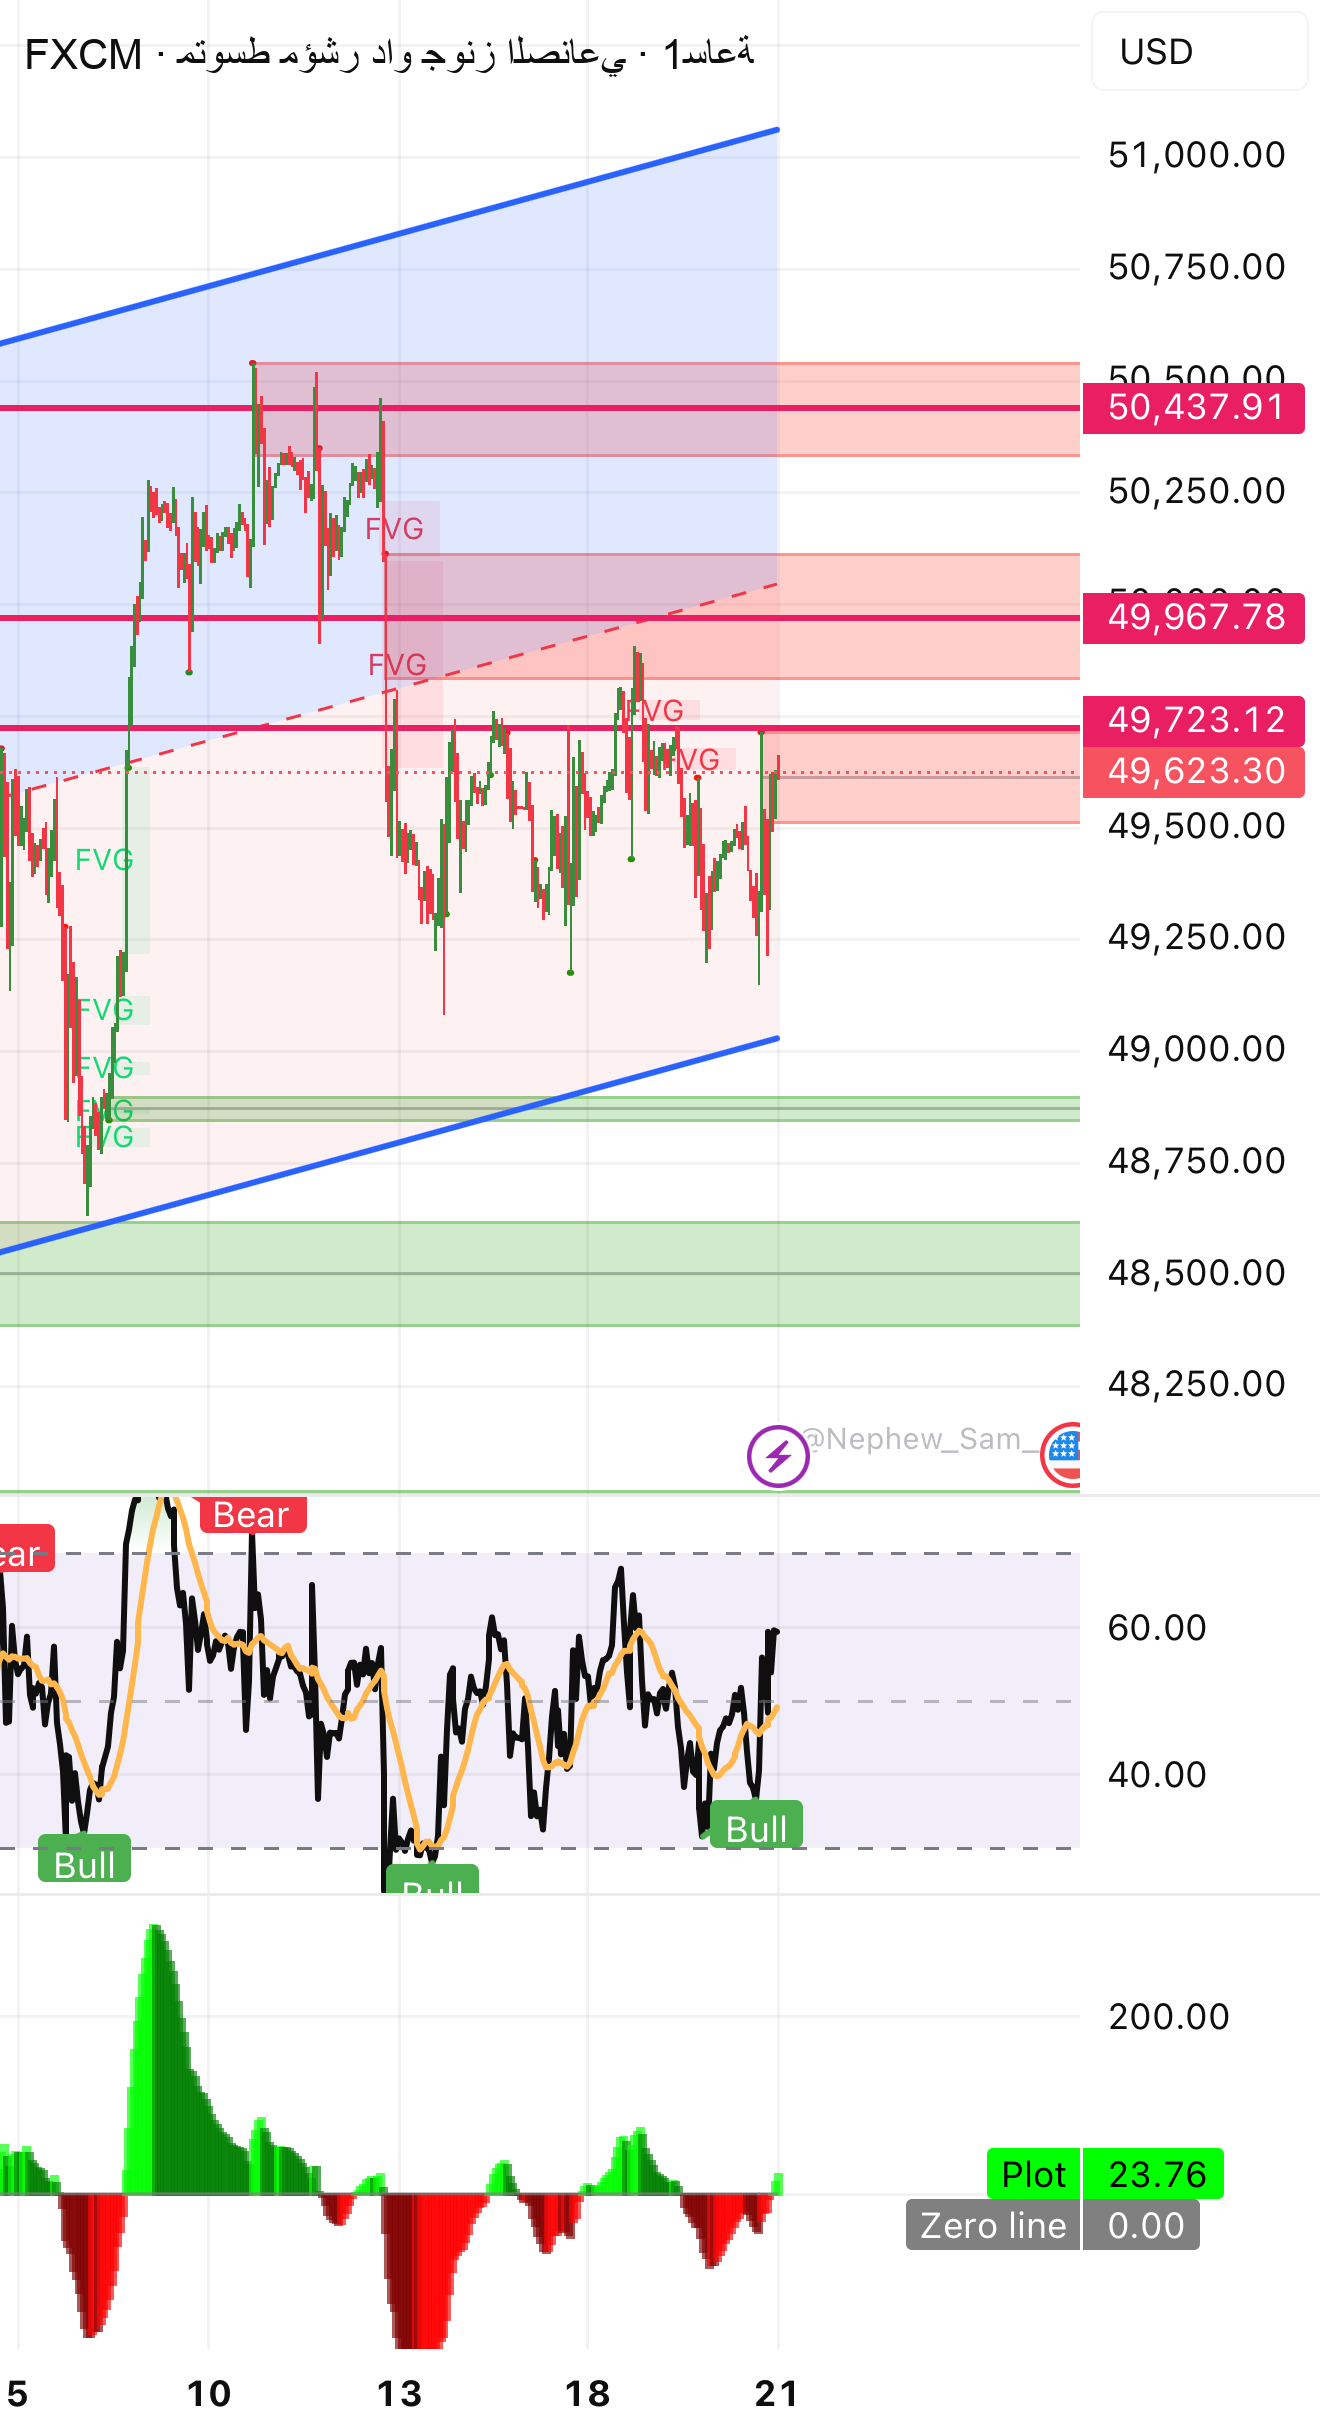

First: General technical analysis
• Price is moving within a clear ascending channel (blue upper and lower borders).
• Price is currently in the middle of an upward sloping channel.
• Occasionally fluctuates between 49,500 – 50,000.
• The bottom of 48,900 points has not been broken → the medium-term trend remains bullish.
Second: Elliott Wave Analysis
Most likely scenario:
• A strong rise represents a pulse wave.
• Current lateral correction is closer to: Fourth Correction Wave (WXY or Extended Flat)
• If stabilization occurs above 49,000, we expect the fifth wave to begin, targeting:
◦ 50,500
◦ 51,000
◦ 51,200 (top of channel)
•
🔴A break above 48,900 would temporarily cancel the bullish scenario.
Third: Time Analysis
• The channel has been running since early February.
• We are at the end of a brief correction cycle.
• The current time supports upward attempts during the upcoming session.
• Any breakout above 50,000 is likely to accelerate 1-2 4-hour candles.
Fourth: Numerical Analysis (Fibonacci Sum Levels)
• Rebound from the previous 61.8% zone.
• 50,000 level = psychological level + strong numerical resistance.
• Next numerical target: 50,500, then 51,040.
Fifth: Fundamental Analysis
• Markets are currently in risk sentiment.
• If there is no negative data or sudden interest rate tightening → the uptrend will continue.
• Any strong negative news could prompt 49,000 people to get tested quickly.
Sixth: Price Action
• Duplicate region rejection 50,000.
• Tightly oscillating candles → accumulation.
• No structural break to the downside yet.
Seventh: Support and Resistance Levels
🔵 Support:
• 49,500 live support
• 49,000 axial supports
• 48,500 areas of strong demand
🔴Resistor:
• 49,900 – 50,000 Psychological Resistance
• 50,500 key resistance level
• 51,040 channel limit
Eighth: Supply and demand areas
🟢Requirement areas:
• 48,800 – 49,000
• 48,400 – 48,600
🔴Display area:
• 49,900 – 50,100
• 50,400 – 50,600
Ninth: Technical model
• Ascending channel
• Rectangular assembly range
• Probability of a bullish flag breakout above 50,000
Tenth: Harmonic Model
It is possible to form a pattern:
• AB=CD, target extended to 50,500 – 50,700
🔥Recommended🔥
Security scenario:
Buy after clearly breaking through 50,050 points
Target:
50,500
50,900
51,040
Stop loss: below 49,500
Alternative:
Only sell if it exceeds 48,900
Target:
48,500
48,200
📌Conclusion:
The medium-term trend is upward
But the market is currently in the strong decision zone (50,000)
ask


