Physical Address
304 North Cardinal St.
Dorchester Center, MA 02124
Physical Address
304 North Cardinal St.
Dorchester Center, MA 02124


Weekly Gold Analysis: Driven by safe-haven demand and policy expectations, gold prices are heading towards the $5,000 level 📈
1: Market Sentiment and Capital Flow: Structural Variations Highlight Gold Investment Value
According to the latest position data from the U.S. Commodity Futures Trading Commission (CFTC) and Intercontinental Exchange (ICE) (for the week ended January 20, 2026), global speculative funds have significantly adjusted key asset allocations, reflecting a reassessment of the interest rate outlook, geopolitical risks and asset classes. Against this background, gold, as an asset with both safe-haven properties and monetary value, continues to attract the attention of capital.
Financing highlights:
Increased demand for safe havens in precious metals: COMEX gold speculative net long positions increased by 2,614 contracts to 139,162 contracts, continuing the recent upward trend 📊.
Caution in the interest rate market: U.S. Treasury futures positions have shifted from net long to net short, indicating that traders are increasingly concerned about interest rate rigidity, which indirectly supports gold’s properties as a currency hedging tool.
The pressure on the US dollar in the foreign exchange market has temporarily eased: the net short positions of major currencies against the US dollar have stabilized, and the value of gold as an asset remains prominent in non-US dollar monetary systems.
Fundamental analysis: Geopolitical risks and policy prospects drove gold prices to record highs 🚀 Spot gold prices broke through resistance last week, hitting $4,900 per ounce for the first time on Thursday (January 22), and consolidated this level to a record high of $4,967 on Friday. The main factors behind this growth are as follows:
Ongoing geopolitical uncertainty: The unpredictability of Trump’s policies has rattled the European Union, undermined long-term confidence in the transatlantic relationship and fueled safe-haven buying.
The weakness of the U.S. dollar and Fed policy expectations: The market’s expectations for the Federal Reserve’s future easing policies continue to heat up, coupled with the pressure on the U.S. dollar, providing dual support for gold.
Central bank gold purchases and private holdings are stable: Based on the logic of “central banks continue to buy gold + private holdings do not sell”, Goldman Sachs raised its gold price forecast to $5,400 per ounce. Currently, gold prices are up nearly 15% since the start of 2026, continuing last year’s 64% annual gain.
⚠️Risk warning: A sharp decline in global monetary policy risks may lead to the liquidation of hedging positions, which may lead to a technical decline in gold prices. Geopolitical developments remain a major factor.
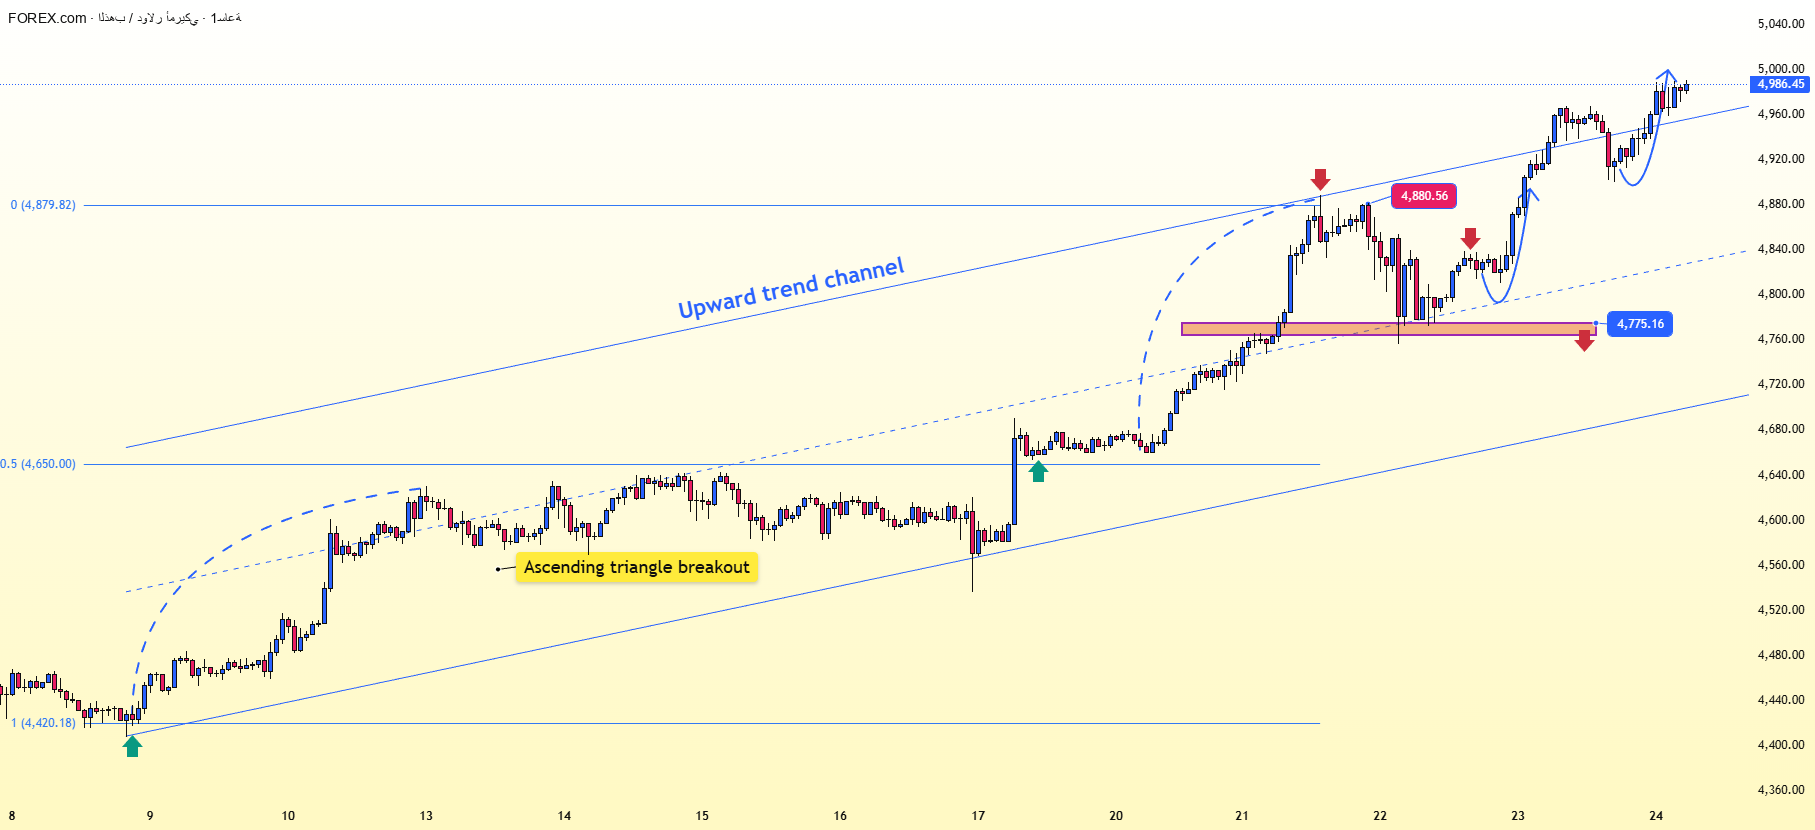
three. Technical analysis: The upward trend is strong; focus on the psychological resistance level of 5,000 points. 🔍Daily chart structure:
In early trading yesterday, gold prices fell from 4832 points to a low of 4770 points and then rebounded strongly. During the U.S. trading session, gold prices broke through the previous high and closed at 4937 points, forming a big positive line with a long lower shadow, indicating strong buying interest at lower levels.
This morning, prices rose above $30 again, approaching the psychological 5,000 mark, indicating clear intentions for a bullish consolidation at higher levels.
Short term trends:
4-hour chart: Stochastics has a golden cross, the MACD line continues to rise, and consecutive bullish candles support the continued bullish momentum.
1-hour chart: The moving averages are in an uptrend. After breaking through the previous high of 4888, a support level was formed, and the main support level rose to 4900-4890. Critical level:
Supported: 4900 (immediate support), 4888 (top/bottom conversion levels)
Resistance levels: 4963 (day high), 5010-5030 (short-term target area)
Fourth: Trading strategies and expectations for next week 🎯 Taking into account fundamental factors such as hedging demand, capital flows, and technical breakthrough patterns, the overall upward trend of gold remains unchanged. However, after the continued rise, a technical correction is expected in the short term.
Trading strategy:
Main trends: Buy low, sell high.
Main support area: 4965-4945. If the price falls to this area and stabilizes, positions can be opened in batches.
Upside target: The current resistance area is 5010-5030. A break above this level could lead to a breakout of the 5100 level.
Risk Management: If the price falls below 4900, the short-term momentum will weaken. It is recommended to reopen buying positions near 4888.
Up and down scenario analysis:
✅ Upside scenario: After stabilizing above 4963, the price is expected to accelerate towards the psychological level of 5000; a breakout of this level will open up new horizons for the upside.
⚠️Consolidation scenario: It is recommended to consolidate in the 4900-4960 range and use time to build momentum.
❌pullback scenario: If the 4888 level is broken, the 4840-4820 support area may be tested.
📌Professional strategy guidance: Do you want to know more detailed daily entry and exit points, position management skills, real-time market analysis and other information? Follow our channel for in-depth analysis to help you accurately grasp trading opportunities in volatile markets! Click to follow and never miss any updates! 👉


