Physical Address
304 North Cardinal St.
Dorchester Center, MA 02124
Physical Address
304 North Cardinal St.
Dorchester Center, MA 02124


Gold technical analysis: Waiting for the Federal Reserve decision to determine the trend, the consolidation pattern faces a breakthrough
Market Review and Focus 🎯At the end of the Asian market on Monday (December 8), the spot gold price maintained its intraday rebound trend and is currently trading around US$4,213 per ounce. The market’s focus this week is entirely on the Federal Reserve’s upcoming interest rate decision and revised dot chart, an event that is expected to trigger the next move in gold prices 🔥.
The market currently generally expects that the Federal Reserve will start cutting interest rates at its December meeting, and this expectation has pushed the U.S. dollar index to 98.90. Recent U.S. economic data have shown the characteristics of “moderate inflation and slowing growth momentum”, causing the market’s probability of an interest rate cut in December to rise from 71% a week ago to 90%📈. Although some economic indicators remain strong (such as the number of initial jobless claims falling to 191,000, a three-year low), creating a complex picture of “moderate inflation and strong employment”, the overall market sentiment tends to put pressure on the dollar, as investors generally believe that slowing economic growth and falling inflation will provide room for the Federal Reserve to adopt more accommodative policies.
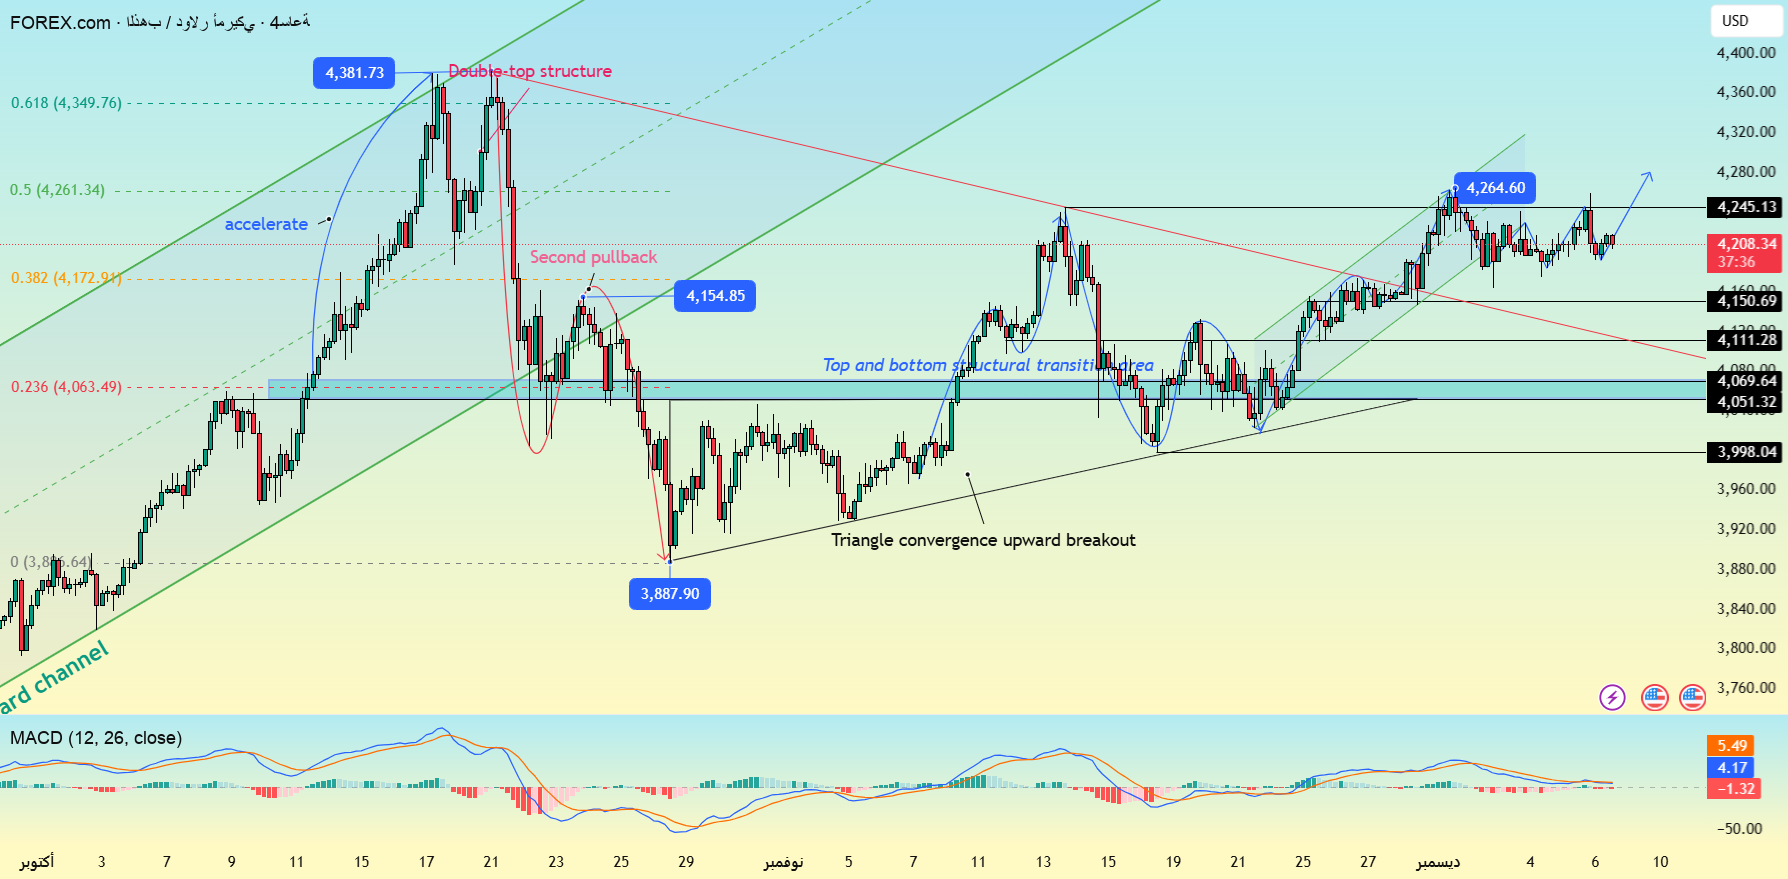
Technical Analysis and Key Levels 📊Daily Chart: Convergence Triangle Ends, Breakthrough Imminent ⚖️The gold daily chart is forming a typical convergence triangle shape, with the trading range continuing to narrow, indicating that the market is in a wait-and-see mode before major events. Currently, bulls and bears are competing repeatedly in the 4190-4200 area, which has become a short-term consolidation area. The obvious upper resistance is at $4,230, and the previous high is at $4,260 (this level has also been the main resistance level since October and is also the short-term overbought area). Lower support is at 4175 (recent low), 4165 and the key 4155-4150 area. The market is nearing the end of a pattern and volatility is at lower levels, often signaling a major directional breakout.
Short-term structure: Stable waiting for breakthrough; 4220 becomes master level. The 4-hour chart shows that after a sharp decline, the price is currently stabilizing in a narrow range, but the rebound strength and duration are insufficient. Prices are still under short-term moving average pressure and maintain a weak and stable pattern. The 1-hour moving average system shows that the market is still fluctuating widely between 4160 and 4260, showing a pattern of “easy to pull back after a high, and easy to rebound after a low”.
Key level: 4220 is now the key dividing line between upward and downward trends. Gold prices are currently trading below this resistance level, indicating that the situation has changed from previous support to effective resistance. Until the price truly stabilizes above the 4250 level, the overall structure will remain under pressure. Basic logic and strategic thinking 🧩 The current calmness in the market is mostly just a wait-and-see strategy before the event occurs. Trading activity around 4200 is essentially a prediction of the direction of Fed policy. The market’s main focus has shifted from “whether interest rates should be cut” to “what policy stance to adopt for interest rate cuts.” The prospect of a “hard rate cut” – in which the Fed could cut interest rates by 25 basis points in response to subtle changes in economic growth – but at the same time send a dovish signal in its policy statement, suggesting that this is not the start of an easing cycle, is particularly worrisome. These expectations pushed U.S. Treasury yields higher last week, increasing the opportunity cost of holding gold and thereby limiting its potential for price gains 📉
Trading Strategy: Markets are likely to remain within their established trading range ahead of the Fed’s decision on Thursday. The smartest strategy is to identify key levels, remain patient, and trade in the direction of the market 🎮. It is expected that after the decision is announced, new trends will gradually become clear.
Specific trading suggestions:
Main strategy: selling at high prices is the main strategy, and buying at low prices is secondary↔️.
Upside resistance: focus on the 4220-4230 mark; a breakthrough of this level will target the 4250-4260 area 🚀.
Downside support: focus on the 4160-4165 mark; a breakthrough of this level will target the main 4150-4155 area 🛡️.
Risk Warning⚠️The Federal Reserve’s announcement on Thursday is not just an interest rate decision, but also a blueprint for the foreseeable future policy direction🗺️. This plays a crucial role in whether gold can escape the current consolidation pattern and restore the volatile market. Investors should pay close attention to the wording of the resolution, changes to the dot plot, and Chairman Powell’s press conference for indicators of subsequent policy paths 🔍.


