Physical Address
304 North Cardinal St.
Dorchester Center, MA 02124
Physical Address
304 North Cardinal St.
Dorchester Center, MA 02124

Main highlights: Global gold prices opened on Friday (January 9), with a relatively narrow trading range. The market is currently affected by multiple factors: the continued rise of the U.S. dollar index, negative expectations for non-agricultural data, and the upcoming annual adjustment of the Bloomberg Commodity Index. These factors are expected to exert short-term selling pressure on gold prices and limit upward momentum. Increased price volatility and the possibility of a pullback next week should be monitored. However, the bullish logic in the medium to long term still exists, with a target price of $5,000 and above.
Today the market will focus on the U.S. unemployment rate and December non-farm payrolls data. Although the data is widely expected to be bearish for gold, the actual results may be better than expected given the performance of ADP employment and jobless claims data released this week. Even if the data is as expected, a single data point is unlikely to change the overall trend. In addition, safe-haven demand driven by geopolitical risks and expectations of sharp interest rate cuts repeatedly hinted by Federal Reserve officials still pose potential support for gold. Therefore, if the data leads to a short-term pullback in gold prices, this may be seen as an opportunity to re-enter long positions.
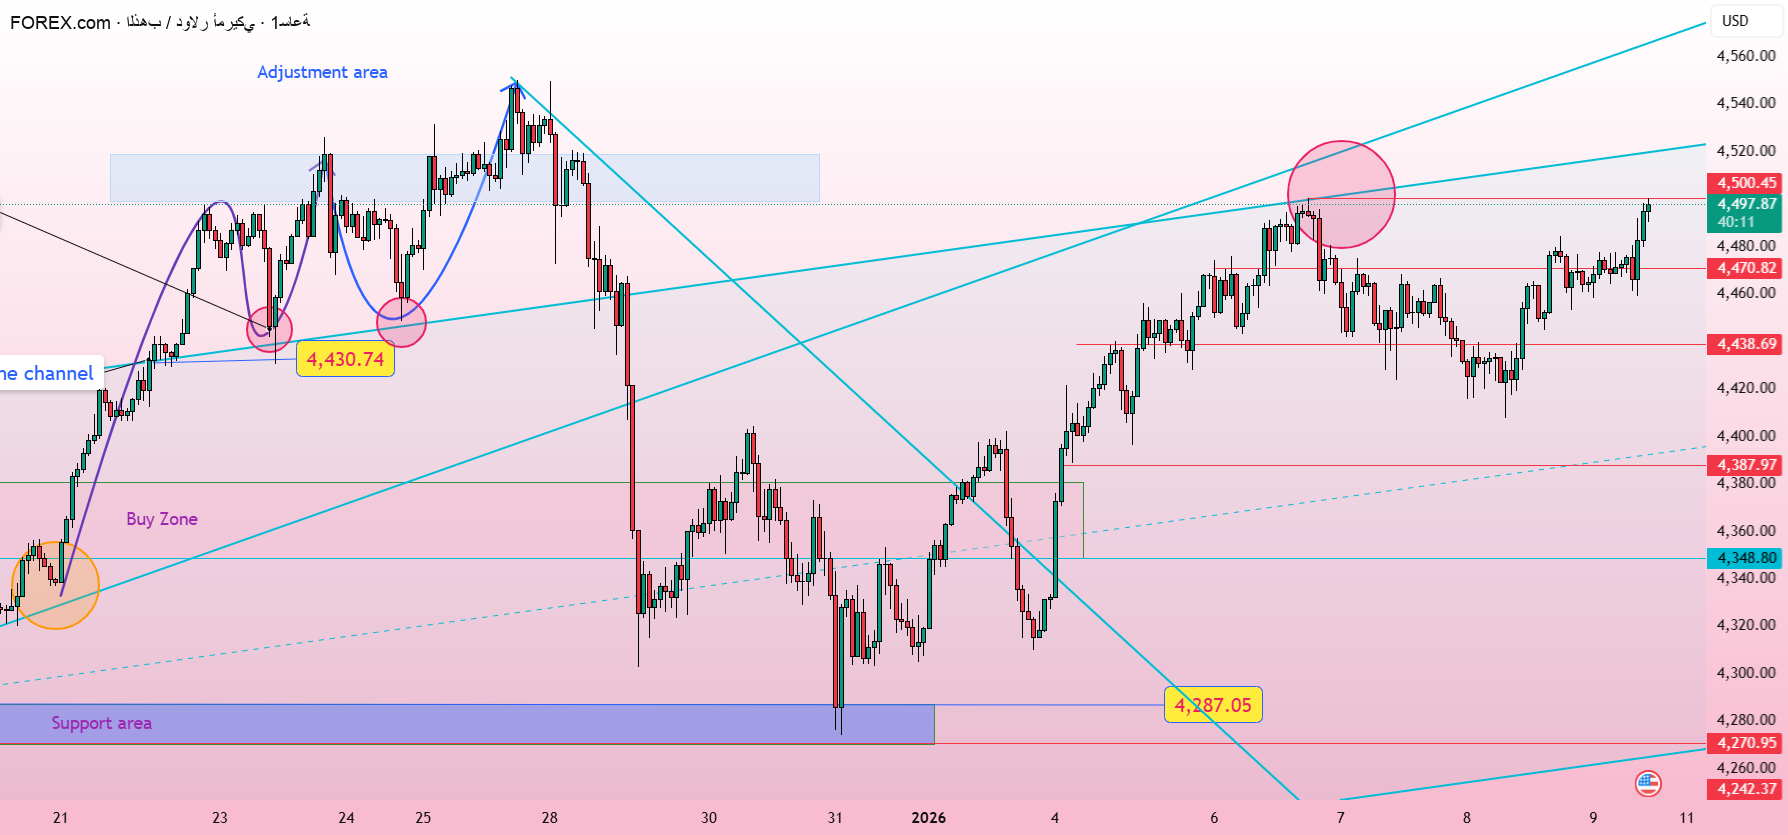
Technical analysis: In the first two trading days of this week, gold prices continued to rise from the 4,300 mark, and with the support of technical forms (such as head and shoulders patterns, double bottom patterns), they broke through the 4,400 and 4,500 marks respectively. Although ADP non-farm employment data and initial jobless claims data were subsequently released, their impact on the trend was limited. Gold maintained a general high accumulation pattern, hitting a high near 4485 on Thursday. The market is currently in a high consolidation stage in an upward trend.
Keep an eye on Friday’s non-farm payrolls data. The previous value was 64,000 and the forecast was 60,000. If the actual value is higher than expected, it may cause the price of gold to fall temporarily; conversely, it may cause it to increase. Judging from the performance of ADP data, the non-agricultural data has upward potential, but the specific fluctuation range will depend on the actual published value.
In the medium to long term, the Federal Reserve will hold a monetary policy meeting at the end of January, and the market will pay close attention to its discussion on the path of interest rate cuts, which will continue to strengthen the bullish outlook for gold at the macro level.
Technically, the daily chart shows a lack of strong upward momentum below the 4,500 mark, indicating that it may enter a callback phase. However, as long as the price remains above the 4400 support, the overall trend remains uptrend. The 4-hour chart shows that the Bollinger Bands are tightening, and the short-term range is concentrated between 4500-4400. Any pullback that does not break through the 4400 key support level can be regarded as a bargain hunting opportunity.
Trading strategy reference: If the non-agricultural data is negative and the price falls, look for buying opportunities when the price falls near the support area above 4400. If the data is positive, watch for price to test the resistance area between 4500-4550. The overall strategy is still to buy when prices fall and consider selling when prices rise.
Critical level:
Resistor: 4520-4540
Support: 4470-4450


