Physical Address
304 North Cardinal St.
Dorchester Center, MA 02124
Physical Address
304 North Cardinal St.
Dorchester Center, MA 02124

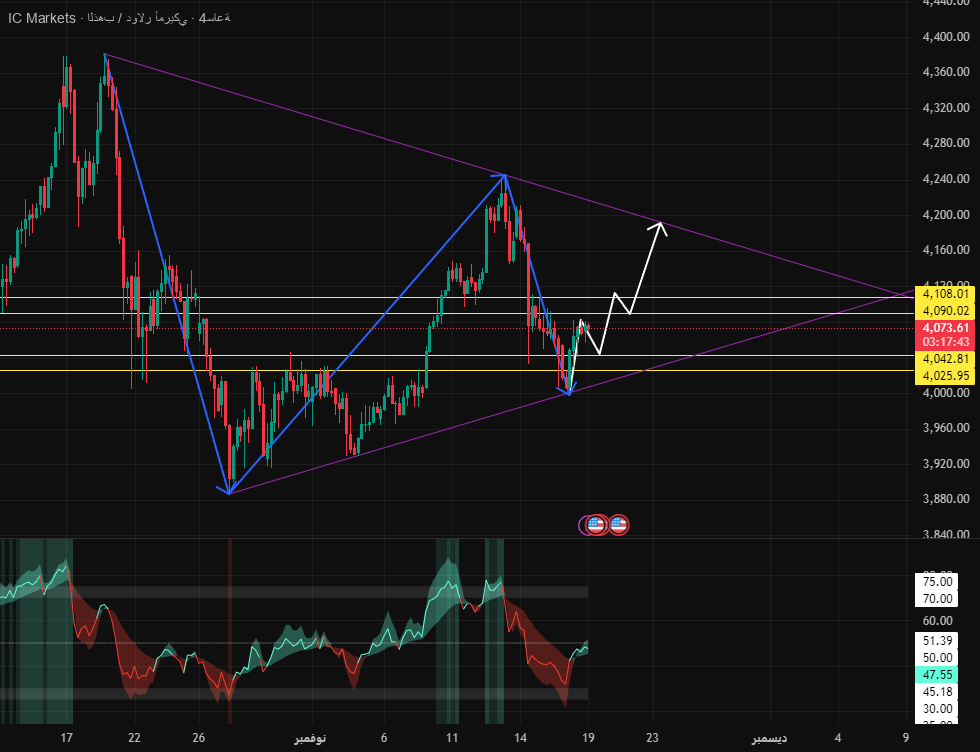

Yesterday, gold prices tested lows and then rebounded, falling first and then rising. The weekly chart shows a decline to around 3998 where it found some support. The relative strength index (RSI) remains close to the midline, with price trading around the midline of the Bollinger Bands. On the short-term (4-hour) chart, the moving averages are converging, the relative strength index (RSI) is close to the midline, and the price is trading between the middle and lower Bollinger Bands. Technically, gold maintains a wide range of fluctuations. The trading strategy is still to buy low and sell high, with the daily trading range being between 4040-4110.
Gold opened slightly higher today. The daily chart is forming a contracting triangle pattern, indicating the potential for further gains. However, don’t forget the release of the Fed meeting minutes during New York today; this news may be positive for gold, and the upward momentum may have started before the news was released. The support below the 4000 mark is very strong, and the market trend has turned from bearish to bullish. There is a high probability that the market will continue to rebound today; the trading strategy is to buy on dips, with the focus being on buying at support levels.
Critical level:
First support: 4062, second support: 4043, third support: 4025
The first resistance: 4090, the second resistance: 4108, the third resistance: 4126
Daily gold trading strategy:
Buy: 4045-4050, stop loss: 4035, take profit: 4070-4080;
Sell: 4115-4120, stop loss: 4130, take profit: 4100-4090;
More analysis←


