Physical Address
304 North Cardinal St.
Dorchester Center, MA 02124
Physical Address
304 North Cardinal St.
Dorchester Center, MA 02124

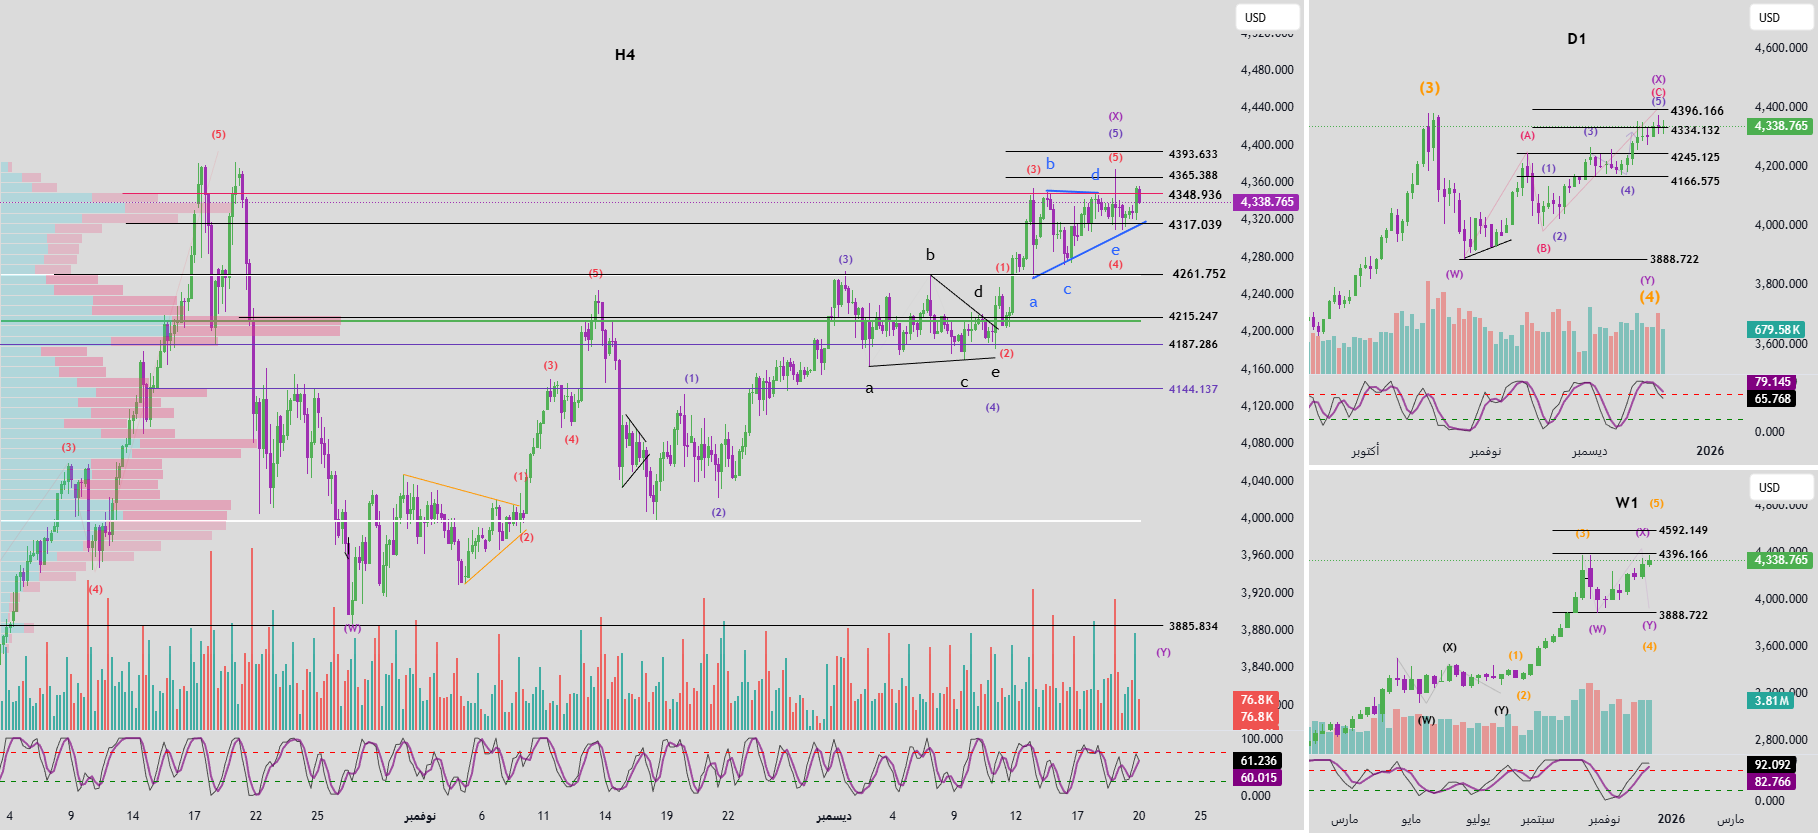
Frame of the Week (W1)
Momentum on the weekly frame is preparing to reverse into a downtrend. If a confirmation candle appears next week, a downtrend could form on the weekly frame, signaling the beginning of a correction phase that could last several weeks.
Daily Frame (D1)
The daily momentum has confirmed a bearish reversal, so expect the bearish trend to dominate in the coming week.
Frame H4
H4 momentum is close to confirming a bearish reversal, indicating that selling pressure may be starting to develop since the opening of the Asian session earlier this week.
2. Elliott wave structure
Frame of the Week (W1)
The price structure on the weekly frame shows that the market is at the top of the third wave (yellow). Combined with the weekly momentum preparing for a reversal, the price may continue into the fourth wave (yellow) in the form of a flat correction.
back wave
Daily Frame (D1)
Within the purple X-wave structure, the red ABC adjustment pattern is forming.
Within the red wave C, we notice a pulse structure consisting of five blue waves (1-2-3-4-5).
Currently, the price is in the fifth blue wave. As the daily momentum reverses to the downside, I expect the fifth blue wave to be complete, which means:
Red C wave completed
Purple X wave completed
After that, the market is likely to enter a bearish phase, forming a Y wave.
In terms of time arrangement:
The last W wave lasted about 3 weeks
Therefore, Y waves are expected to take at least a similar amount of time
Next week, I expect to see strong selling pressure and a sharp and clear downward move in the form of a five-wave bearish structure.
H4 structure
Looking at the blue fifth wave, one can observe the internal structure consisting of five red waves (1-2-3-4-5).
Price’s previous break above the 4365 level indicated that the objective of the fifth red wave has been achieved.
Current status:
Daily momentum reverses lower
H4 momentum is in the process of reversing downwards
Price failed to break out and stabilize above 4365
The last candle closed below 4348 points
Based on this data, I expect the top of wave 5 to have formed.
3. Volume overview and price scenarios
From a volume profile perspective:
The 4348 level represents an area of high liquidity and is a strong resistance level
Prices have not yet been able to decisively penetrate this area
Main bearish scenarios:
If the price closes below the 4317 level (low liquidity area) when the next trading day opens, the price could quickly move through this area and fall towards the next high liquidity area near 4215.
This scenario would constitute strong confirmation that the fifth wave is complete.
Alternative:
If the price manages to break out and hold above 4348, the fifth wave may not be complete yet and may extend in the form of a terminal triangle. In this case, I will continue to monitor the upper targets and update the analysis as more data becomes available.
4. Trading plan
At current levels, this area is a good potential sales area.
However, in order to determine an accurate entry point, I will need further confirmation from price action when the market opens tomorrow. I will update my trading plan when clearer signals emerge.


