Physical Address
304 North Cardinal St.
Dorchester Center, MA 02124
Physical Address
304 North Cardinal St.
Dorchester Center, MA 02124

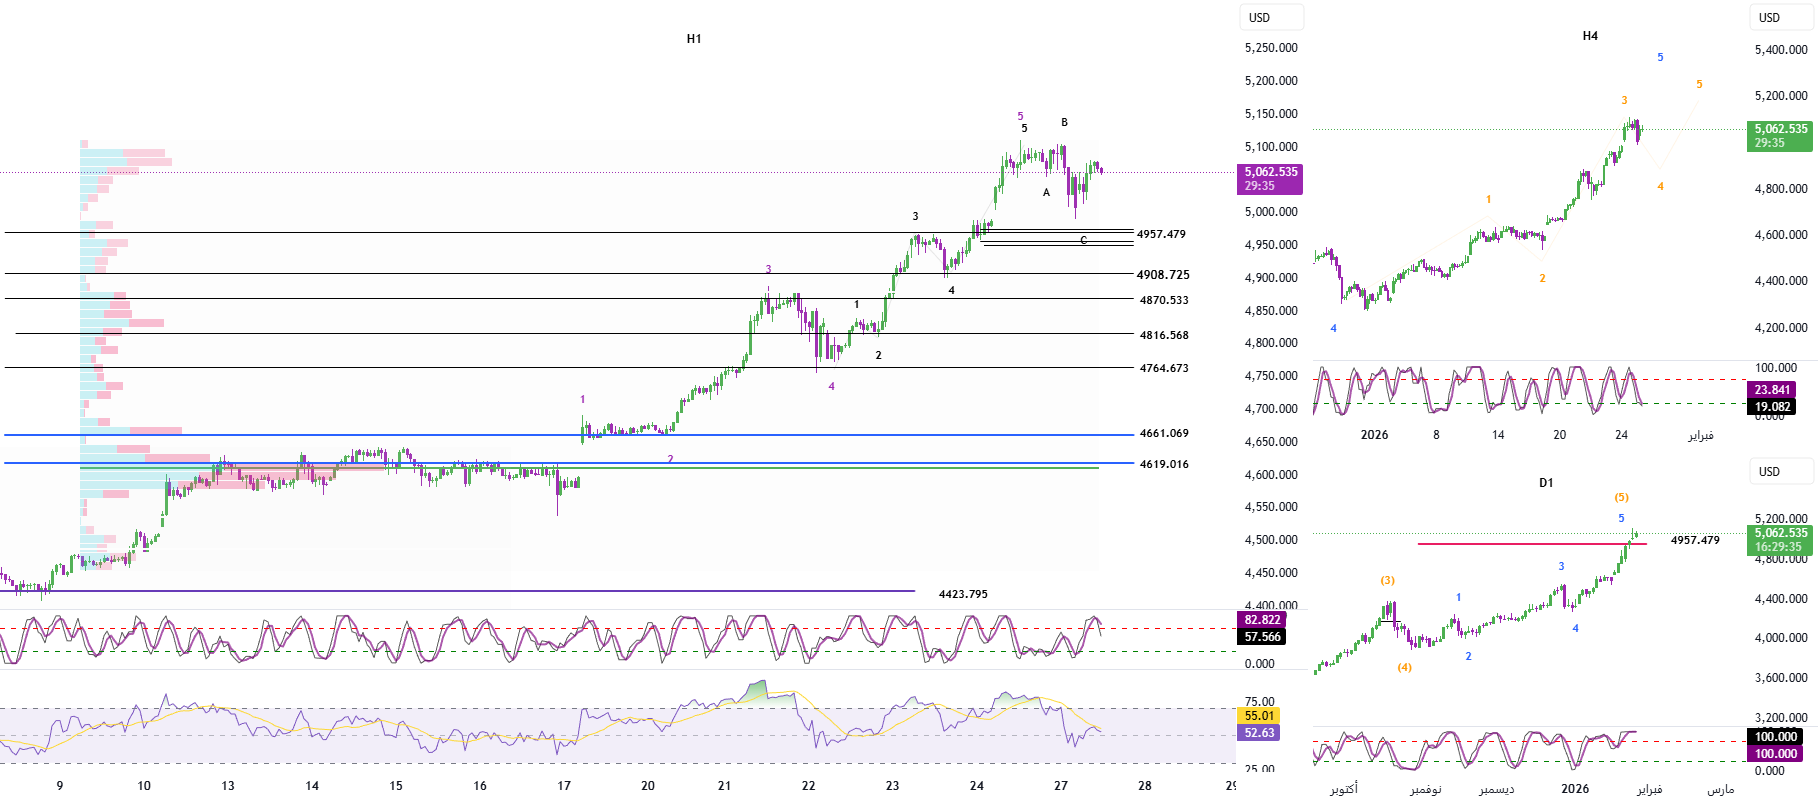
Daily time range (D1)
– Momentum on the daily frame is currently consolidating. This suggests that purchasing power is still there, but momentum is starting to wane, suggesting a potential risk of a reversal.
→ The overall trend is still upward, but caution is needed to avoid a strong correction.
H4 time frame
– H4 momentum is currently in oversold territory.
→ This indicates that the H4 framework may be forming a bottom and a bullish reversal may occur in the near term.
H1 time frame
– Momentum in the first half is currently trending downward.
→ In the short term, H1 may continue to correct for a few more H1 candles before the corrective move is complete.
2. Wave structure
Wave structure on the daily frame (D1)
– On the daily chart, the price is still moving within a structure consisting of five waves (1-2-3-4-5) marked in blue.
Currently, the fifth wave of blue is in an extended state, which makes determining the exact end point very difficult.
In the Elliott Wave Theory, this stretch reflects the extreme state of buying psychology.
When market psychology returns to normal, the next adjustment is often sharp and intense.
→ Therefore, XAUUSD at the current stage requires a high degree of caution.
Wave structure on H4 frame
– The correction structure on the H4 frame is being expanded and includes many internal substructures.
→ Therefore, the wave number cannot be accurately determined until the structure is fully completed.
– Currently, we rely on two basic principles to define monitoring areas:
Waves of the same magnitude are often similar in time and price length.
Waves within a single structure are often related to each other through Fibonacci ratios.
– So I currently have a temporary yellow 1-2-3-4-5 structure number placed on the H4 frame for later use.
– Until this time, the H4 correction wave is still compatible with the correction wave within the yellow third wave.
H4 follow-up scene
– If H4 momentum reverses upwards and the price manages to break above the previous highs, we may still be in the third wave of the yellow.
If the next rise of H4 fails to form a new peak, the probability of the market entering the yellow fourth wave will increase.
Wave structure on H1 frame
– On the H1 framework, the ABC adjustment structure has been formed, and the price is currently in a rebound trend.
-But now:
– Momentum reversed to the downside in the first half
Price failed to form new highs
→ Therefore, we are not rushing to enter, but waiting:
– H1 momentum reaches oversold zone
– You can then consider buying the deal, depending on:
– ABC correction structure on H1
– This is consistent with the expected bullish reversal in H4 momentum
3. Target area
– There are several Fibonacci convergence areas near the price level 4957.
→ This area is a potential target for H1 end-of-frame correction.
– Regarding profit targets:
– We will continue to monitor the momentum reversal in the first half and second half
– Once upward momentum is confirmed, trades will be managed in stages.
4. Trading plan
– Purchase area: 4958 – 4955
– Stop loss: 4937
– Profit target:
– TP1:4978
– TP2:5021
– TP3:5060


