Physical Address
304 North Cardinal St.
Dorchester Center, MA 02124
Physical Address
304 North Cardinal St.
Dorchester Center, MA 02124


⸻
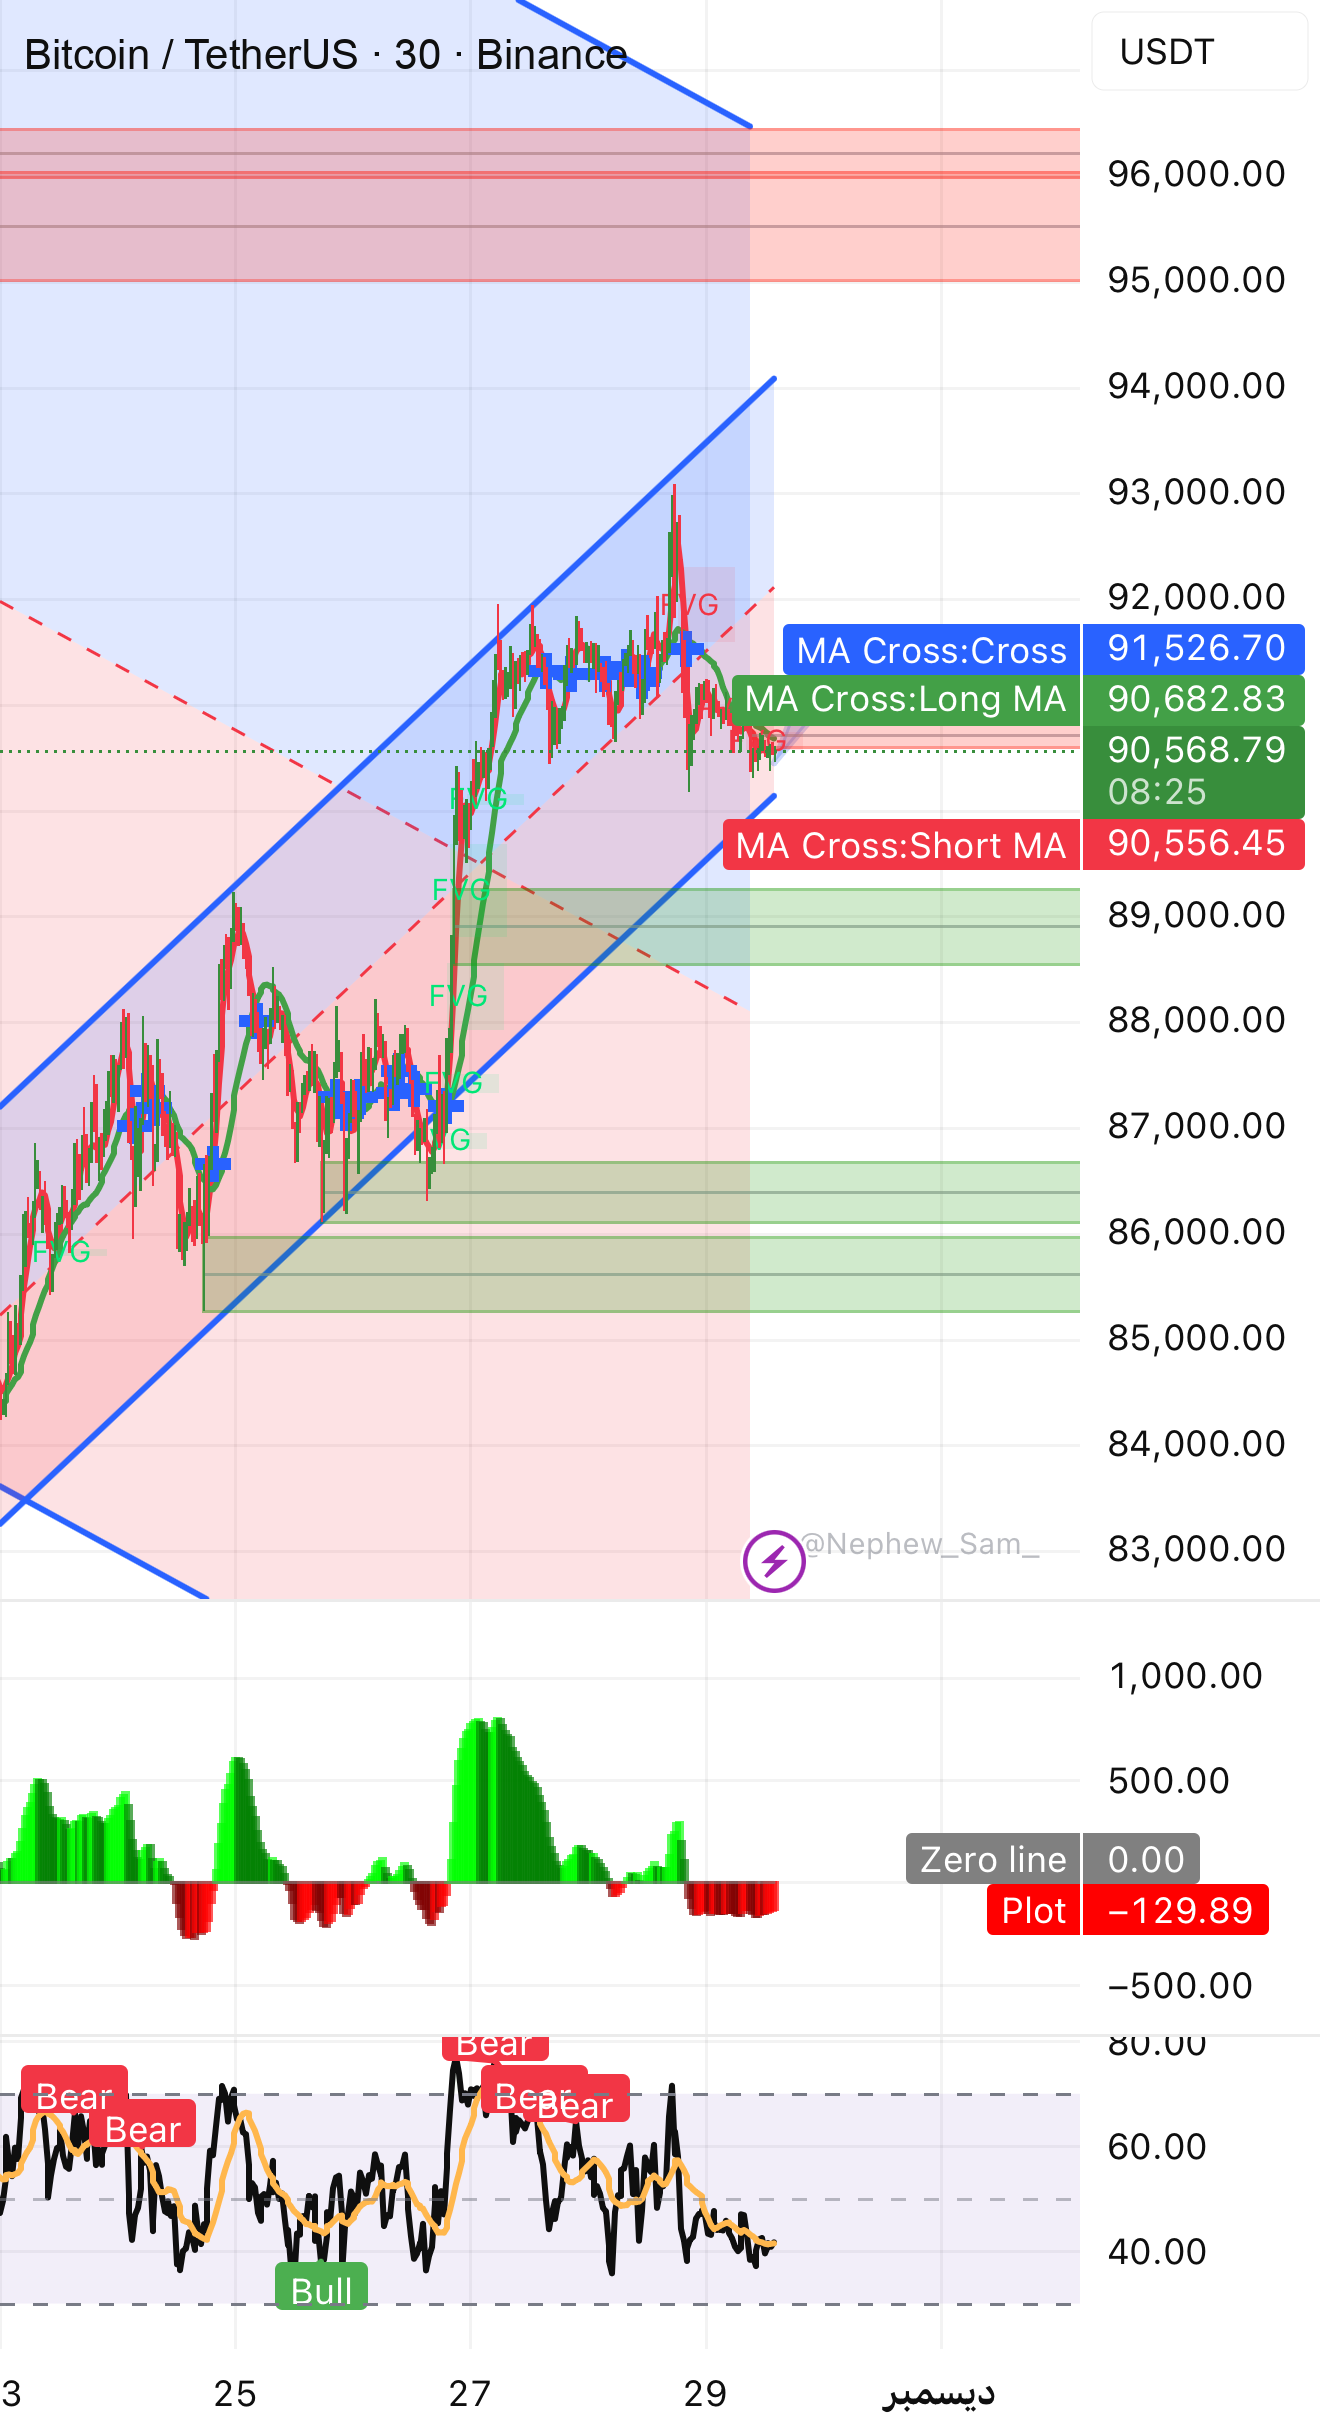
🎯First – the general trend
• Short term: Corrective bearish trend within a broken uptrend channel.
• Medium-term trend: Still bullish as long as strong 88,000-87,000 demand zone remains.
• Macro: Very bullish due to fundamentals (halving + ETF liquidity + lack of supply).
⸻
📉Second-Technical Analysis
1. Ascending channel
• The lower boundary of the ascending channel has been breached → signal of weakness.
• Price now retests 91,000 – 90,800.
• Failure to close above 91,200 points means the decline will continue.
⸻
2. Supply and demand area
Strong display (red):
• 92,300 – 93,000
• 95,000 – 96,000
• 99,000 – 100,000
Strong demand (green):
• 90,300 – 89,700 (current region)
• 88,200 – 87,400 (strongest)
• 86,000 – 85,000 (last before crash)
⸻
3. Key support and resistance levels
• Current resistance:
• 91,200
• 91,800
• 92,600
• Immediate support:
• 90,300
• 89,700
• 88,300
⸻
🔺Third wave analysis
• The current wave is a corrective wave (wave B or 4) in a large uptrend.
• Prices have ended a strong upward wave and are now in a downward sloping correction wave.
• The next wave is expected after the correction ends:
• Phased increase to 93K → 96K → 100K.
But before that, we need a small dip to complete the correction.
⸻
⏳ Fourth – Time Analysis
• The 89,700–88,300 region shows strong temporal consistency (clear aggregation).
• Time prediction:
• Today-Tomorrow: Slight downward pressure.
• After 36 hours: A rising wave may occur.
⸻
🔢Fifth – Digital Analysis
• RSI at 1H and 4H:
• 35-40 zone → close to saturation.
• Smoothed Moving Average Convergence and Divergence:
• Bearish but close to positive crossover.
This means the bottom is very close.
⸻
🔥 Sixth – Price Action
Judging from the picture:
• Candles with long tails below → clear sell rejection.
• Price consolidates above demand zone → Positive indicator.
• No break above 89,700 = Strong bullish signal.
⸻
🌀 Seventh – Harmonic Model
The model now consists of:
Bullish ABCD or Sharks
The first expected goal:
• 92,000 – 92,600
⸻
🎯Eighth – Gaze Point and Pivot Area
• Pivot area:
90,500
The price is higher than it → rises
The price is below it → falls briefly
⸻
📌Finally – clear recommendation (based on current photos)
✅ Prepare trades and close stop loss on request
🎯 Purchase tickets
Log in:
90,500 – 90,300 (current area is very good)
🛑 Very Close Stop Loss (SL):
Only 89,700
🎯Goal:
• Target 1: 91,600
• Target 2: 92,300
• Target 3: 93,000
• Target 4 (if it increases and explodes)
Important tips
We do not provide you with financial and investment advice
Instead, we provide you with scientific and educational content
You are the only one responsible for pressing the buy and sell buttons
analyst
Engineer Ihab
Sayed Al-Dhahab Telegram Channel


